A number of news stories claim that a recent paper by Lovejoy proves that the probability that the warming of the past century is entirely due to natural causes is less than one percent. I find the conclusion plausible enough, but, so far as I can tell, there is no way that it can be derived in the way Lovejoy is said to have derived it.
The first problem, probably the fault of the reporters not of Lovejoy himself, is the misinterpretation of what the confidence result produced by classical statistics means. If you analyze a body of data and reject the null hypothesis at the .01 level, that means that if the null hypothesis is true, the probability that the evidence against it would be as strong as it is is less than .01—the probability of the evidence conditional on the null hypothesis. That does not imply that the probability that the null hypothesis is true given that the evidence against it is that strong is less than .01—the probability of the null hypothesis conditional on the evidence. The two sound similar but are in fact entirely different.
My standard example is to imagine that you pull a coin out of your pocket, toss it without inspecting it, and get heads twice. The null hypothesis is that it is a fair coin, the alternative hypothesis that it is a double headed coin. The chance of getting two heads if it is a fair coin is only .25. It does not follow that, after getting two heads, you should conclude that the probability is .75 that the coin is double headed. For previous discussions of this issue see this one in the contest of World of Warcraft and this in the context of DNA analysis of mummies.
The second problem is that, so far as I can tell, there is no way Lovejoy could have calculated the probability that natural processes would produce 20th century warming from the data he was using, which consisted of a reconstruction of world temperature from 1500 to the present. The paper is sufficiently complicated so that I may be misinterpreting it, but I think his procedure went essentially as follows:
Assume that changes in global temperature prior to 1880 were due to random natural causes. Use the data from 1500 to 1875 to estimate the probability distribution of natural variation in global temperature. Given that distribution, calculate the probability that natural variation would produce as much warming from 1880 to 2008 as occurred. That probability is less than .01. Hence reject the assumption that warming from 1880 on was entirely due to natural causes at the .01 level.
The problem with this procedure is that data from 1500 on can only give information on random natural processes whose annual probability is high enough so that their effect can be observed and their probability calculated within that time span. Suppose there is some natural process capable of causing a global temperature rise of one degree C in a century whose annual probability is less than .001. The odds are greater than even that it will not occur even once in Lovejoy's data. Hence he has no way of estimating the probability that such a process exists. The existence of such a process would provide an explanation of 20th century warming that does not involve human action. So he cannot estimate, from his data, how likely it is that natural processes would have produced observed warming, which is what he is claiming to do. 20th century warming would, in that case, be what Taleb refers to as a Black Swan event. If one swan in a thousand is black, the observer looks at five hundred swans, finds all of them white, and concludes, incorrectly, that the probability of a black swan is zero.
How does Lovejoy solve that problem? If I correctly read the paper, the answer is:
Stated succinctly, our statistical hypothesis on the natural variability is that its extreme probabilities ... are bracketed by a modified Gaussian...
In other words, he is simply assuming a shape for the probability distribution of natural events that affect global climate. Given that assumed shape, he can use data on the part of the distribution he does observe to deduce the part he does not observe. But he has no way of testing the hypothesis, since it is a hypothesis about a part of the curve for which he has no data.
If I am correctly reading the paper—readers of this post are welcome to correct me if they think I am not—that means that Lovejoy has not only not proved what reporters think he has, he has not proved what he thinks he has either. A correct description of his result would be that the probability that natural processes would produce observed warming, conditional on his assumption about the shape of the probability distribution for natural processes that affect global temperature, is less than .01.
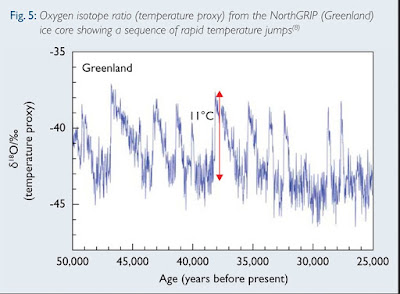
One obvious question is whether this problem matters, whether, on the basis of data other than what went into Lovejoy's paper, one can rule out the possibility of natural events capable of causing rapid warming that occur too infrequently for their probability to be deduced from the past five hundred years of data. I think the answer is that we cannot. The figure below is temperature data deduced from a Greenland ice core. It shows periods of rapid warming, some much more rapid than what we observed in the 20th century, occurring at intervals of several thousand years. During one of them, "The temperature increased by
more than 10°C within 40 years." The temperature shown is local not global—we do not have the sort of paleoclimate reconstructions that would be needed to spot similar episodes on a global scale. But the fact that there are natural sources of very rapid local warming with annual frequency below .001 is an argument against ruling out the possibility that such sources exist for global warming as well.
In my next post, I pointed out that not only was it possible that there existed a low probability process capable of producing rapid warming whose cause and hence probability was independent of the higher probability processes Lovejoy observed, it appears to have actually happened—certainly Lovejoy believes it did. AGW itself is a black swan in precisely the sense discussed above.
12 comments:
The claims in my paper are correct as explained, although the press release was obvious highly summarized.
For the first point - if I understood it properly - you are simply pointing out that the statistical rejection of a hypothesis does not allow you to make any conclusions about the truthfulness of any specific alternative. This point is correct and is clearly and explicitly acknowledged in the paper (e.g. last sentence): “While students of statistics know that the statistical rejection of a hypothesis cannot be used to conclude the truth of any specific alternative, nevertheless - in many cases including this one – the rejection of one greatly enhances the credibility of the other.“ (This last part is because we're doing science, not statistics!).
As for the second point yes, clearly one needs to make an assumption about the probability tails. I explicitly describe that assumption: that the distribution is asymptotically a power law - and I give a theoretical justification from nonlinear geophysics: power law probability tails are generic features of scaling processes (such as the global temperature up to about 125 years). Scaling also comes in because I use it to extrapolate from the 64 year distributions to the 125 year distributions, but there is big literature on this scaling (some of it is cited). Finally there is specific evidence going back to 1985 (cited in the paper) for power law probabilities in climatological temperatures including with the exponent qD = 5. Classical statistics assume Gaussian distributions (qD = infinity) and the latter hypothesis would make the extremes 100 to 10000 even less likely. For my 99% confidence result to be invalid, the power law would have to be incredibly strong and start at probabilities below around 0.001. Even if you don’t like power law tails, they are quite extreme and are considered as bounds.
The reporting was indeed abysmal as usual.
While it is an interesting approach that your paper takes, its conclusions are only as strong as the proxy reconstructions it relies on. That is really the crux when correctly interpreting any such 99% figure.
The way I would summarize your methodology, is that it quantifies the naturalness of a given reconstructions. Say one puts a hockey stick in, your method will tell us that this shape isn't very natural, as compared to direct temperature data. Whether this unnaturalness should be pinned on said hockey stick, or actual temperature developments, is then where the crux lies.
I have a hard time imagining you'd get these kind of 99% figures vis a vis a proxy that does exhibit a distinct MWP. If such a >99% event were taking place, youd see a dramatic feature in temperature developments; but the only place I am seeing anything dramatic is in the variability between these different proxies themselves.
And that shouldn't be news to anyone. We are talking here about the proxy reconstructions of Ammann and Wahl, torch bearers of Mann, infamous for their refusal to publish their R^2 statistics; or otherwise show that their proxy reconstructions have any relation whatsoever to instrument data.
Viewed in anther light, you could say that your paper proves with >99% confidence that Steve McIntyre has a point about the merits of these proxy reconstructions. It all depends on what you start out assuming; are the thermometers out of line because they look crazy relative to our long term proxies, or are our proxies worthless because they have little to do with our thermometer data?
The matter can be decided by looking at the time period for which the two overlap. There is relatively little such overlap compared to how far these proxies aspire to extrapolate, so lets say the jury is still out there. But it isn't looking too good for the proxies id say, concerted efforts to 'hide the decline' notwithstanding.
Shaun: Thanks for the reply.
I wasn't complaining about you with regard to the first point but about the news stories. Non-statisticians routinely confuse the probability of the evidence conditional on the null with the probability of the null conditional on the evidence, because the latter is what they want and sounds very much like the former. As noted in my post, I've complained about that several times in the past in other contexts.
And I agree that you described your assumption--I quoted you doing it, I think.
But the black swan problem occurs precisely because one doesn't know what the shape of distributions is going to be. In this case, I don't see how you can eliminate the possibility of some rare large effect coming from a different mechanism than the ones that generate the smaller effects you are observing in your sample--say something coming from some rare change in solar behavior.
To make it specific, suppose there is a mechanism that generates a degree C warming in a century, roughly what we have seen, has an annual probability of .002, and doesn't happen to have occurred since 1500. Its probability isn't deducible from a Gaussian, power law, or anything else, because it is coming from a different mechanism than the natural effects you have observed and so can't be predicted from their distribution.
I don't see how you can eliminate such a possibility, or even assign a probability to it.
I think there are other reasons to be pretty sure that some of the modern warming is anthropogenic. But it seems to me that your approach depends on assumptions you have no way of testing, hence cannot yield the sort of unqualified conclusion you seem to want it to yield. You can conclude that modern warming is very unlikely to have occurred as a result of a random lining up of the natural factors observed in your sample, but I don't see how you can get beyond that.
But in any case, thanks for your response.
Shaun writes:
"the statistical rejection of a hypothesis does not allow you to make any conclusions about the truthfulness of any specific alternative. "
It doesn't even let you make any conclusions about the truthfulness of the hypothesis you have rejected. If your prior that it is true is strong enough, you can modify it via Bayes Theorem and still end up believing the hypothesis is true.
My standard example is the coin flip experiment I described in my post. Assume, for simplicity, that all coins are either fair or double headed. Since I believe double headed coins are extremely rare, a series of ten heads, probability 1/1024, still won't convince me that the coin isn't fair.
The Null Hypothesis has never been falsified.
The Null Hypothesis states that current climate parameters [temperatures, extreme weather events, etc.] have all been exceeded in the past. Nothing we observe today is unusual or unprecedented.
Lovejoy's paper is a crock. He is just grant-trolling. I suppose I can't blame him for fishing for taxpayer loot, but his presumption that current climate parameters are caused by human activity is total nonsense.
Temperatures have changed by tens of degrees — on decadal time scales — within the past fifteen thousand years. But now the climate alarmist crowd is going ballistic over tenths of a degree warming. Could they be any less credible?
The "carbon" scare is designed for only one thing: to pass big tax increases. It has nothing whatever to do with science. If you want to really understand the science behind global warming, there is no site better than this one:
http://wattsupwiththat.com
Get educated. Or join the Chicken Little contingent. Your choice.
Lovejoy makes the statistical mistake of comparing proxies with thermometer records. He then concludes that since the proxies don’t behave statistically like thermometers, CO2 must be the cause.
There are two unproven assumptions in his work:
1. Humans excluded, proxies and thermometers will have similar statistical behavior.
2. Any difference in the statistical behavior between proxies and thermometers can only be due to human produced CO2.
Occam’s Razor tells us proxies and thermometers will not behave the same simply because they are not the same, without any need to involve CO2.
Perhaps I can make my point clearer by arguing that there is a sense in which the Lovejoy paper is internally inconsistent—proves too much.
Suppose the paper was written in 1880. The analysis of the temperature record since 1500, supposing it had been available, would have shown that the probability of a temperature increase of about a degree during the next century was less than .01. The implicit assumption producing that conclusion was that the mechanisms that could produce warming in the 20th century were the same ones that produced it in the past, so the probability distribution could be calculated from past data.
That assumption was wrong because a new mechanism--human industrialization and its effect on climate--had appeared. The probability of that happening couldn't have been predicted from past temperature data.
What actually happened was a black swan event—and the probability calculation would not have predicted it.
Lovejoy special cases the warming after 1880 because, after it happened, he could see that it was due to a new cause, hence not "natural." But before it happened, before there was any reason to separate out human causation from any other causation, his analysis "proves" that what happened wasn't going to.
Curious you should reference your post on the King Tut DNA analysis, given that, after a pretty thorough investigation of the actual paper (published in JAMA), it turned out the authors had not in fact performed a classical statistical analysis, but rather a Bayesian analysis. So it turned out to be a poorly chosen example to illustrate your pet peeve around mistaken conclusions of frequentist-based statistics, something Andrew kindly pointed out in one of the final comments to that post.
Dr. Lovejoy says:
"The claims in my paper are correct..."
No. It appears that no one is in agreement with that statement.
First, the only correlation between CO2 and temperature occurred over a very short time period, from about 1980 – 1997.
Further, the rise in CO2 always FOLLOWS a rise [or decline] in T. That cause and effect is clearly visible, from years to hundreds of millennia. At no time does ∆CO2 lead ∆T. That fact is based on empirical observations, not on models, and it thoroughly deconstructs the "human fingerprint" nonsense.
Next, there is no other correlation between T & CO2; the entire "carbon" scare was instigated based on the El Nino of 1996-1997. The reality is that the scare is over a few tenths of a degree in T fluctuation. But that is apparently enough to get the grant money flowing, even though none of the 'science' stands up to even mild scrutiny.
Finally, even the arch-alarmist Phil Jones shows that current observations are no different from past observations. Everything we observe today has happened in the past, repeatedly, and to a much greater degree.
There is no credibility in those sounding the "carbon" alarm. There is no "human fingerprint" observed in global warming. None. People who claim there is have no familiarity with the climate Null Hypothesis, or with Occam's Razor, or for that matter, with the Scientific Method. But I suppose the pay is good.
Those pushing the "carbon" scam used to debate skeptical scientists. But no more. And why not? It is because the alarmists have lost every debate. They lack scientific credibility, and they are unable to refute the simple facts that skeptics raise. So now, they run and hide out from any fair, moderated debate held in a neutral venue. That is a shame. Debates between scientists bring out the truth.
There is no credible science behind the global warming scare. It is all smoke and mirrors, and this paper is no different.
Really, who should we listen to? Dr. Lovejoy? Or Planet Earth?
Because they cannot both be right.
There is an enormous difficulty with papers such as this. The statistics of climate between time A and Time B tell us nothing about the phisical reality of the cause.
Put simply Lovejoy asserts that statistically recent warming presumed due to CO2 is "real" regardless of whether such an effect is physically possible. For example a paper some years ago forecast that annual precipitation would increase by 20 percent, even though the energy imbalance driving that supposed effect could only cause a 0.8% increase in precipitation. Lovejoy is happy to have the law of conservation of energy violated in order to assert his unscientific statistical linking of CO2 and climate.
Shaun, before you go calculating statistics to validate a predetermined conclusion you should really validate the predetermined conclusion. Try this one for example.
Science tells us that the earth is currently 33 degrees above theoretical for no atmosphere, and CO2 is currently at 85 percent of it's absorbtion potential. What is the rate of rise of temperature per percent energy absorbed in the stopband? For the 15 % remaining practical absorbtion potential what is the maximum rise possible, and the maximum climate sensitivity based on the evidence of C02 energy absorption and all cause warming above blackbody.
One more thing to ponder, the imbalance that's supposedly driving climate armageddon is 0.6W per square meter, that about the energy of a small christmas tree light in a column of turbulent air 1m x 1m x 3km, that is free to radiate and convect. Intuitively how dangerous can it be?
I am no statistician, but this paper simply makes an utterly trivial claim - that is the recent variation in our climate is not natural, then it's probably not natural.
To "prove" that it is not natural, recent variation is excluded from the data set of what is assumed to be natural. Then of course, it is shown to be not natural.
But to do that, you have to prove that the data set you use contains all possible natural variation - but that is simply not done.
Forget the fancy stats and methodologies, prove that the data set is complete. Otherwise this is just a pointless exercise.
May I offer a comment I placed on Anthony Watts blog "WattsUpWithThat?"which is germane here? Lovejoy is simply captive to the false belief that carbon dioxide is the cause of global warming. Nothing can be further from the truth since James Hansen demonstrably did not prove the existence of the greenhouse effect in 1988.
Comment by Arno Arrak
WUWT April 27, 2014 at 8:33 pm
Lovejoy boasts that ““This study will be a blow to any remaining climate-change deniers.Their two most convincing arguments – that the warming is natural in origin, and that the computer models are wrong – are either directly contradicted by this analysis, or simply do not apply to it.” First, he has a nerve to generalize about deniers because he is just setting up a straw man to knock them down. Fortunately he chooses to use carbon dioxide as a causative agent which is easy to smash. First, carbon dioxide as the root cause of all global warming started its career with Hansen’s talk to the Senate in 1988. Hansen showed a rising temperature chart from 1880 to 1988. Its high point in 1988 represented the warmest point within the last 100 years, he said. There was only a 1 percent chance that this could have happened by chance alone. And since it ruled out chance it was proof that the greenhouse effect had been detected. No one ever checked his science and on the strength of his presentation IPCC was started up that same year. But if you check out his hundred year warming curve you find that it includes the early century warming from 1910 to 1940. Under no circumstances can this warming be used to support greenhouse theory. There was no parallel increase of atmospheric carbon dioxide in 1910 when it started. This rules out greenhouse warming by the radiation laws of physics. And carbon dioxide was not removed from the air in 1940, the only way you can stop greenhouse warming. Clearly, we have to take off the part of his 100 year warming curve earlier than 1940. That lops off sixty of those 100 years. What is left is a see-saw, 25 years of cooling followed by 23 years of warming. No way does this amount to proof of the existence of the greenhouse effect. But the IPCC nevertheless followed him and still follows him. Venerating the emperor’s new clothes, no doubt. If you want to do real climate science, you have to give up carbon dioxide as a causative agent. Lovejoy has chosen the emperor, however, and is marching along, wondering why the emperor has chosen such fancy clothes to show his subjects.
Post a Comment